Google Ads is a highly competitive platform where multiple advertisers bid for the same audience. But how do you know who your real competitors are and how well you’re performing against them?
That’s where Auction Insights comes in!
The Google Ads Auction Insights Report provides real-time competitor data, helping advertisers refine their strategies, adjust bids, and improve ad placements to outperform the competition.
In this guide, we’ll break down:
- What Google Ads Auction Insights is, and how it works
- How to access and interpret the report
- Key metrics explained in simple terms
- Proven strategies to use Auction Insights to beat competitors
What Are Auction Insights in Google Ads?
Auction Insights is a competitive analysis tool within Google Ads that allows you to see how your ads compare to competitors bidding on the same keywords.
Unlike other competitor research tools, Auction Insights shows real-time ad auction data, making it one of the most accurate ways to assess Google Ads bidding competition.
This data helps advertisers:
- Identify major competitors in the same ad auctions
- Determine impression share vs. competitors
- Adjust bidding strategies for better positioning
- Optimize ad placements based on competitor behavior
Pro Tip: Regularly checking Auction Insights can help you track new competitors entering the market and identify opportunities to dominate your niche.
How to Access Auction Insights Report?
To find the Auction Insights report in Google Ads:
- Log into Google Ads
- Navigate to the Campaigns, Ad Groups, or Keywords tab
- Select the segment you want to analyze
- Click on “Auction Insights”
Pro Tip: You can analyze Auction Insights at different levels—Campaign, Ad Group, or Keyword—depending on how granular you want the data.
Key Metrics in Auction Insights (Explained)
The Auction Insights report provides six key performance metrics that help you analyze where you stand against competitors:
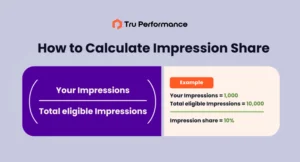
1. Impression Share
Definition: The percentage of times your ad appeared out of the total available impressions.
- Higher Impression Share: Strong ad visibility and budget allocation
- Lower Impression Share: Competitors may be outbidding or outranking you
Example: If your Impression Share is 60%, your ads appeared 60 times out of every 100 available searches.
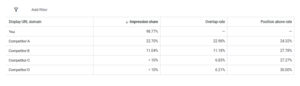
2. Overlap Rate
Definition: How often another advertiser’s ad appears in the same auction as yours.
- High Overlap Rate: Frequent competition with the same advertiser
- Low Overlap Rate:Less direct competition
Example: If Competitor A has a 20% overlap rate, it means their ads appeared 20% of the time in the same auctions as yours.
3. Position Above Rate
Definition: How often another advertiser’s ad appears in a higher position than yours when both were shown in the same auction.
- High Position Above Rate: Competitor bids higher or has better quality scores
- Low Position Above Rate: You are ranking higher than the competitor
Example: If Competitor B has a 27% position above the rate, their ad ranked above yours 27% of the time when both were shown.
4. Top of Page Rate
Definition: The percentage of times your ad appeared at the top of the search results (above organic listings).
- Higher Top of Page Rate: Your ad gets prime visibility
- Lower Top of Page Rate: Competitors are taking the top spots
Example: If your top-of-page rate is 75%, it means your ad appeared in the top section of Google Ads 75% of the time.
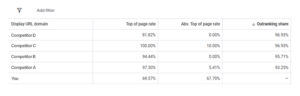
5. Absolute Top of Page Rate
The percentage of times your ad was the very first ad on the search results page.
- High Absolute Top Rate: Your ad consistently wins the top position
- Low Absolute Top Rate: Competitors are outbidding you for the top spot
Example: If Competitor C has a 10% absolute top-of-page rate, their ad appeared in the #1 position in 10% of auctions.
6. Outranking Share
Definition: How often your ad ranked higher than a competitor’s or appeared when their ad didn’t show.
- Higher Outranking Share: You are consistently outperforming a competitor
- Lower Outranking Share: Competitors are outbidding you more frequently
Example: If your outranking share against Competitor D is 96%, your ad was ranked higher than theirs or appeared when there wasn’t 60% of the time.
How to Use Auction Insights to Improve Performance
Now that you understand the metrics let’s look at how to apply these insights to optimize your campaigns.
1. Adjust Your Bidding Strategy
- If your Impression Share is low, consider increasing bids or budget.
- If a competitor consistently outranks you, test bid adjustments or Smart Bidding strategies like Target Impression Share.
2. Optimize Ad Quality for Better Rankings
Google Ads considers more than just bids—it also evaluates Quality Scores (CTR, relevance, landing page experience).
- Higher Position Above Rate? Improve ad copy, landing page experience, and overall Quality Score.
- Use responsive search ads to test multiple variations and boost engagement.
3. Monitor Competitor Trends & Adjust Strategy
Competitor behavior fluctuates over time, so review Auction Insights regularly and adjust accordingly.
- If new competitors emerge, assess their overlap rate and analyze their ad copy.
- If competitors drop out, capitalize on the opportunity to increase market share.
4. Leverage Ad Extensions for Better Visibility
If competitors are ranking higher, improve your ad visibility by adding:
- Callout Extensions (Highlight unique services)
Callout Extensions are short, descriptive text snippets that appear below your ad copy to highlight key benefits, services, or special offers.
- Structured Snippets (Showcase specific practice areas)
Structured Snippet Extensions allow advertisers to display a list of related offerings or categories under predefined headers like Services, Amenities, Brands, or Types.
- Site Link Extensions (Drive traffic to important landing pages)
Sitelink Extensions provides additional clickable links below your main ad, allowing users to navigate directly to relevant pages on your website (e.g., Contact Us, Pricing, About Us, or Specific Services).
The Google Ads Auction Insights Report is a powerful competitive analysis tool that can help you make data-driven decisions and outperform your competitors.
You can fine-tune your bidding strategy, optimize ad quality, and boost your campaign performance by analyzing key metrics like Impression Share, Position Above Rate, and Outranking Share.
Want to dominate your competition in Google Ads? Start by analyzing your Auction Insights report today!


Share this blog